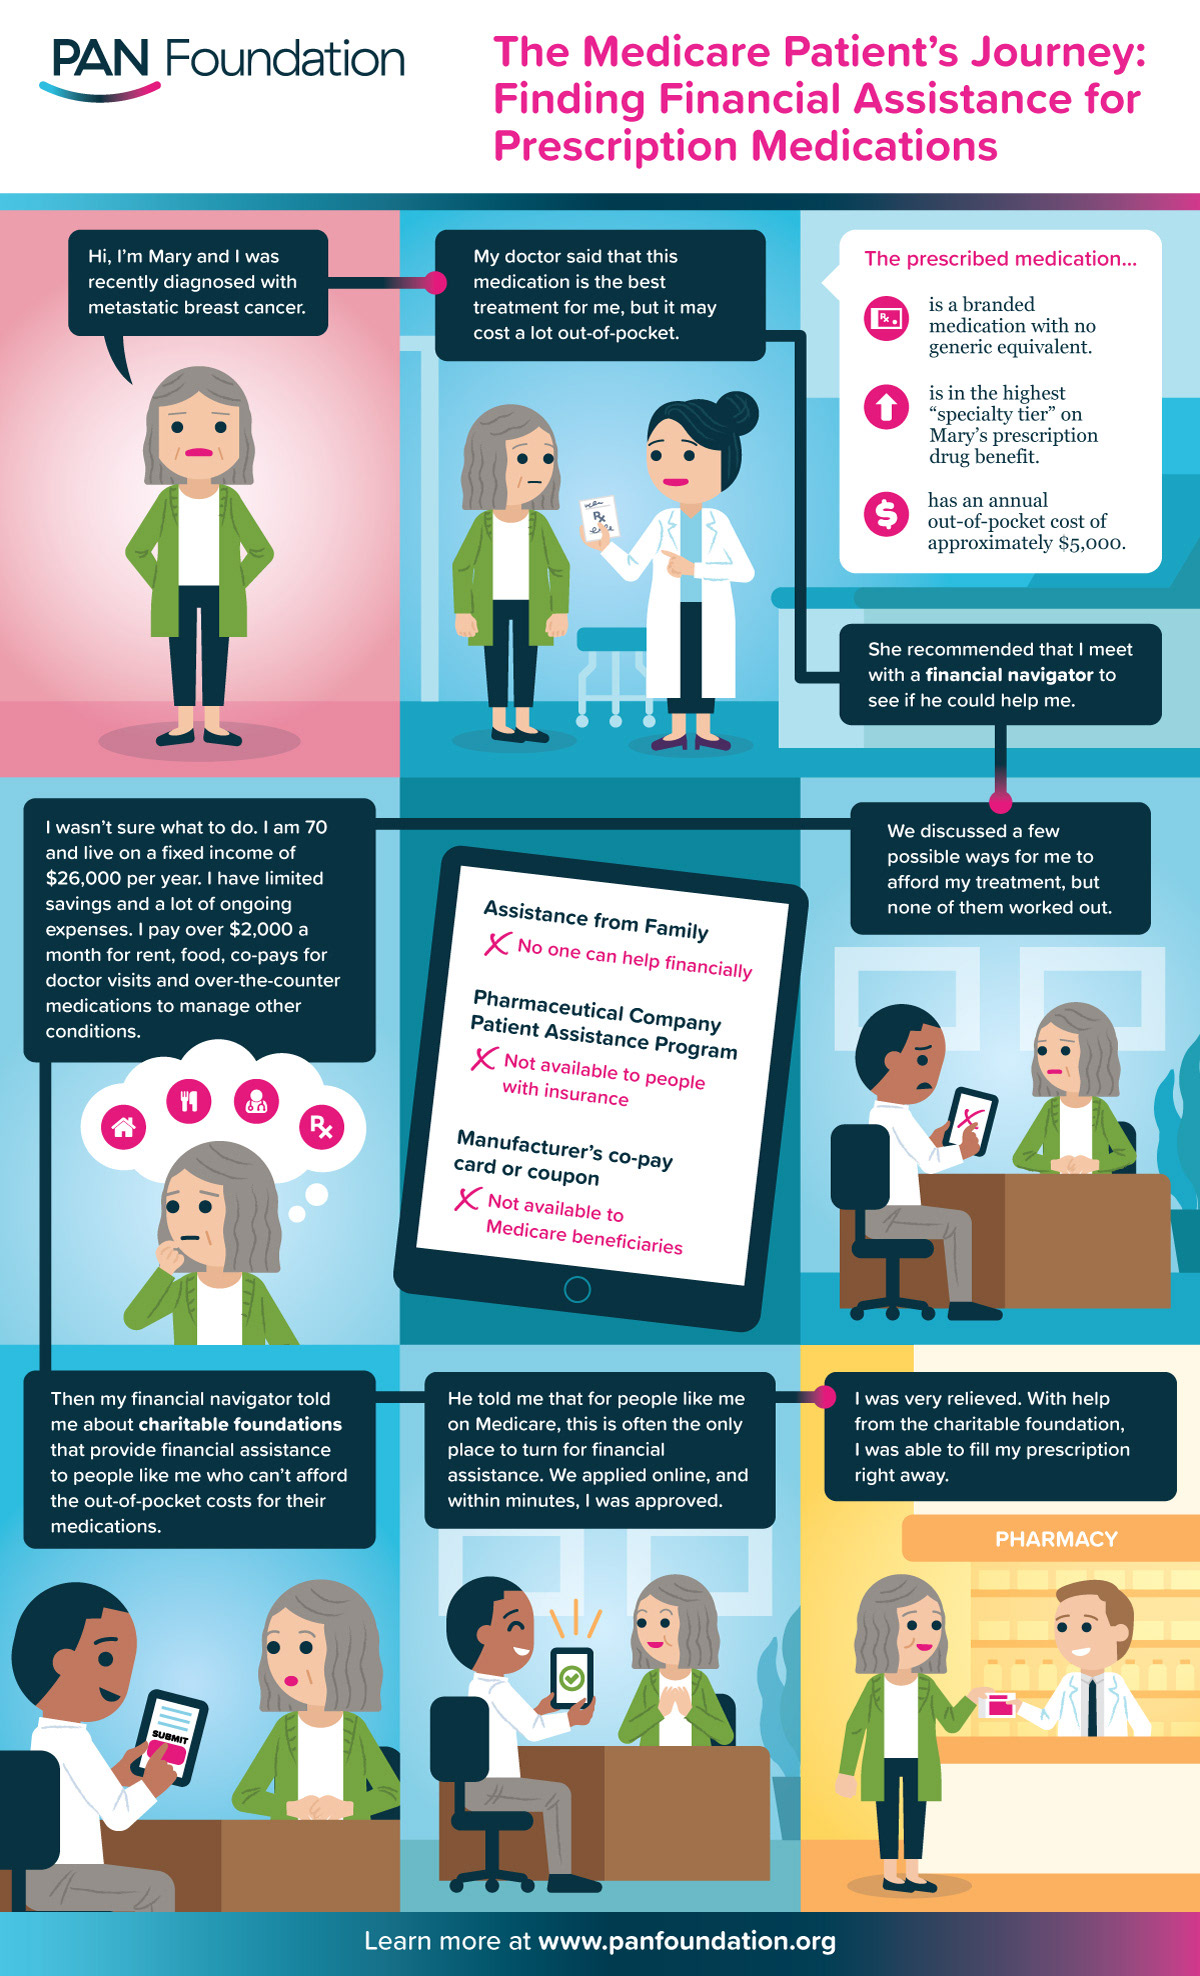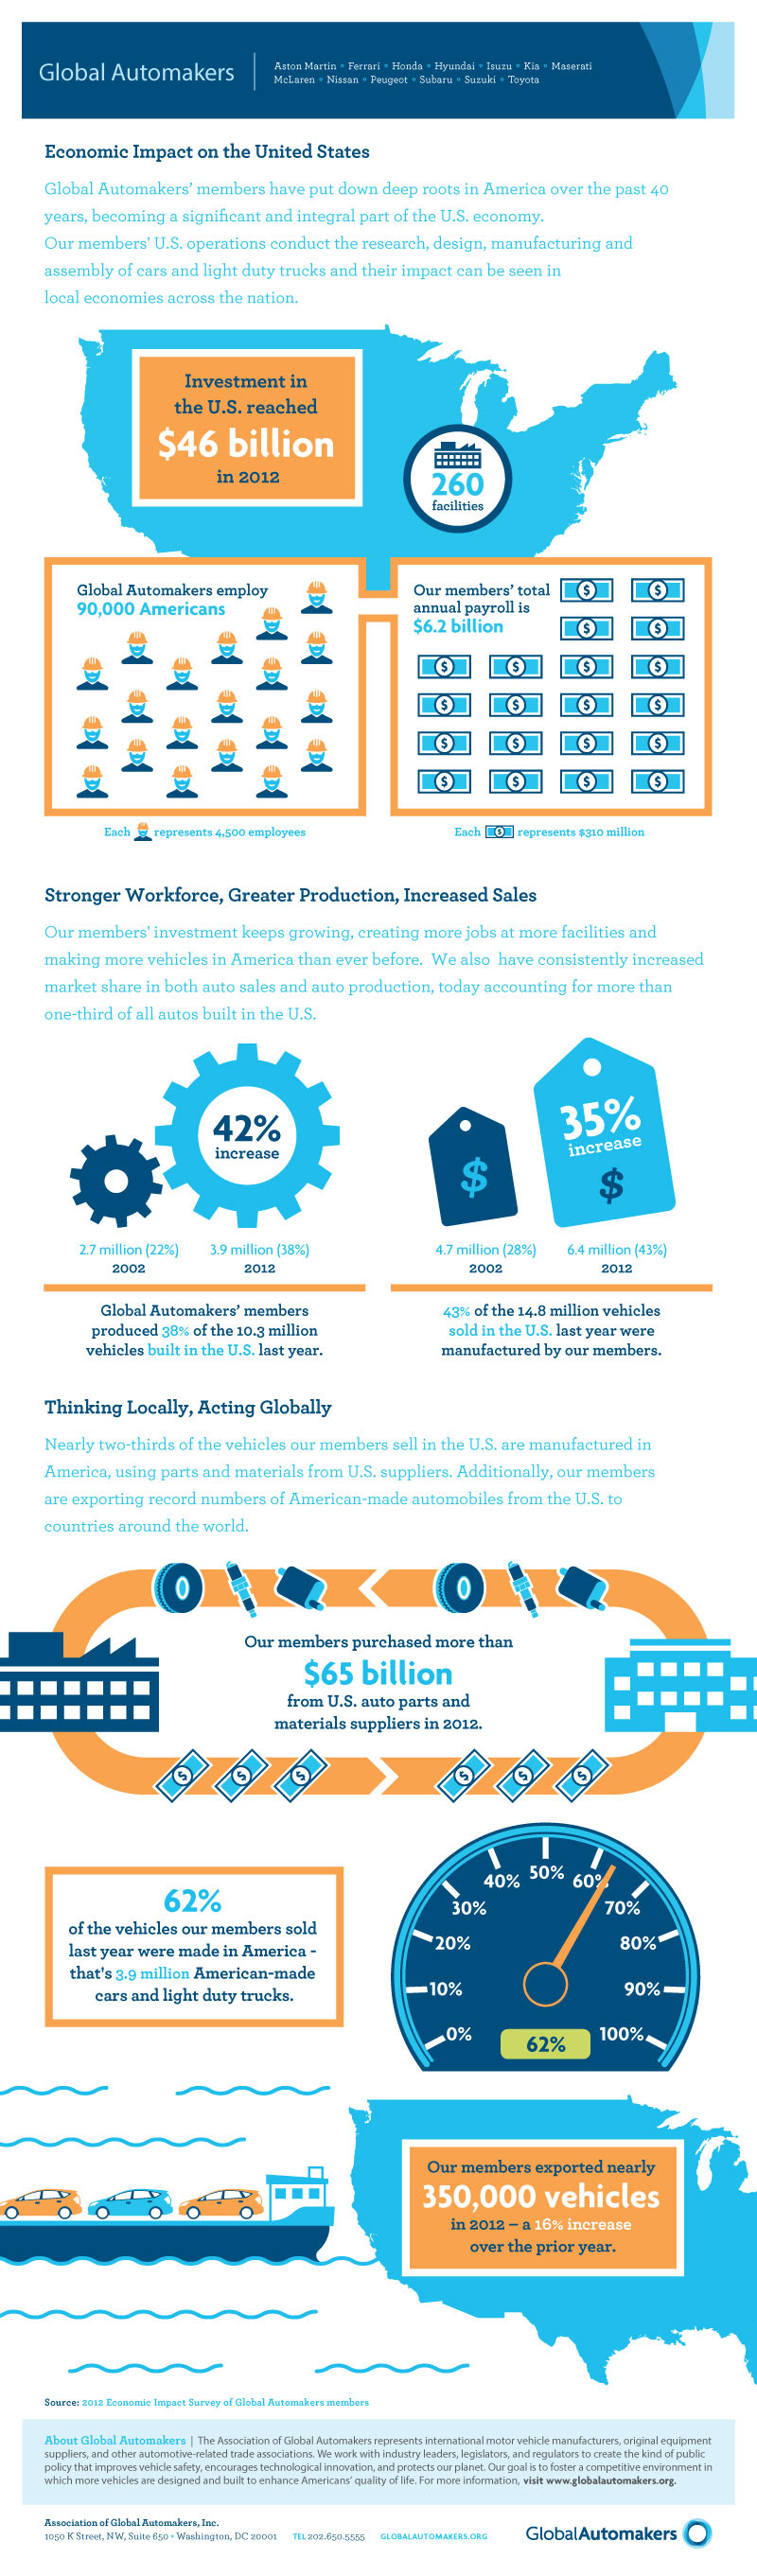
Infographics make your data more accessible and help to create a narrative around your findings. Infographic designs can range from the more minimalist and number-driven, to highly illustrative short stories. They also allow you to be more intentional in setting the tone, whether it be more straightforward or more bright and fun.